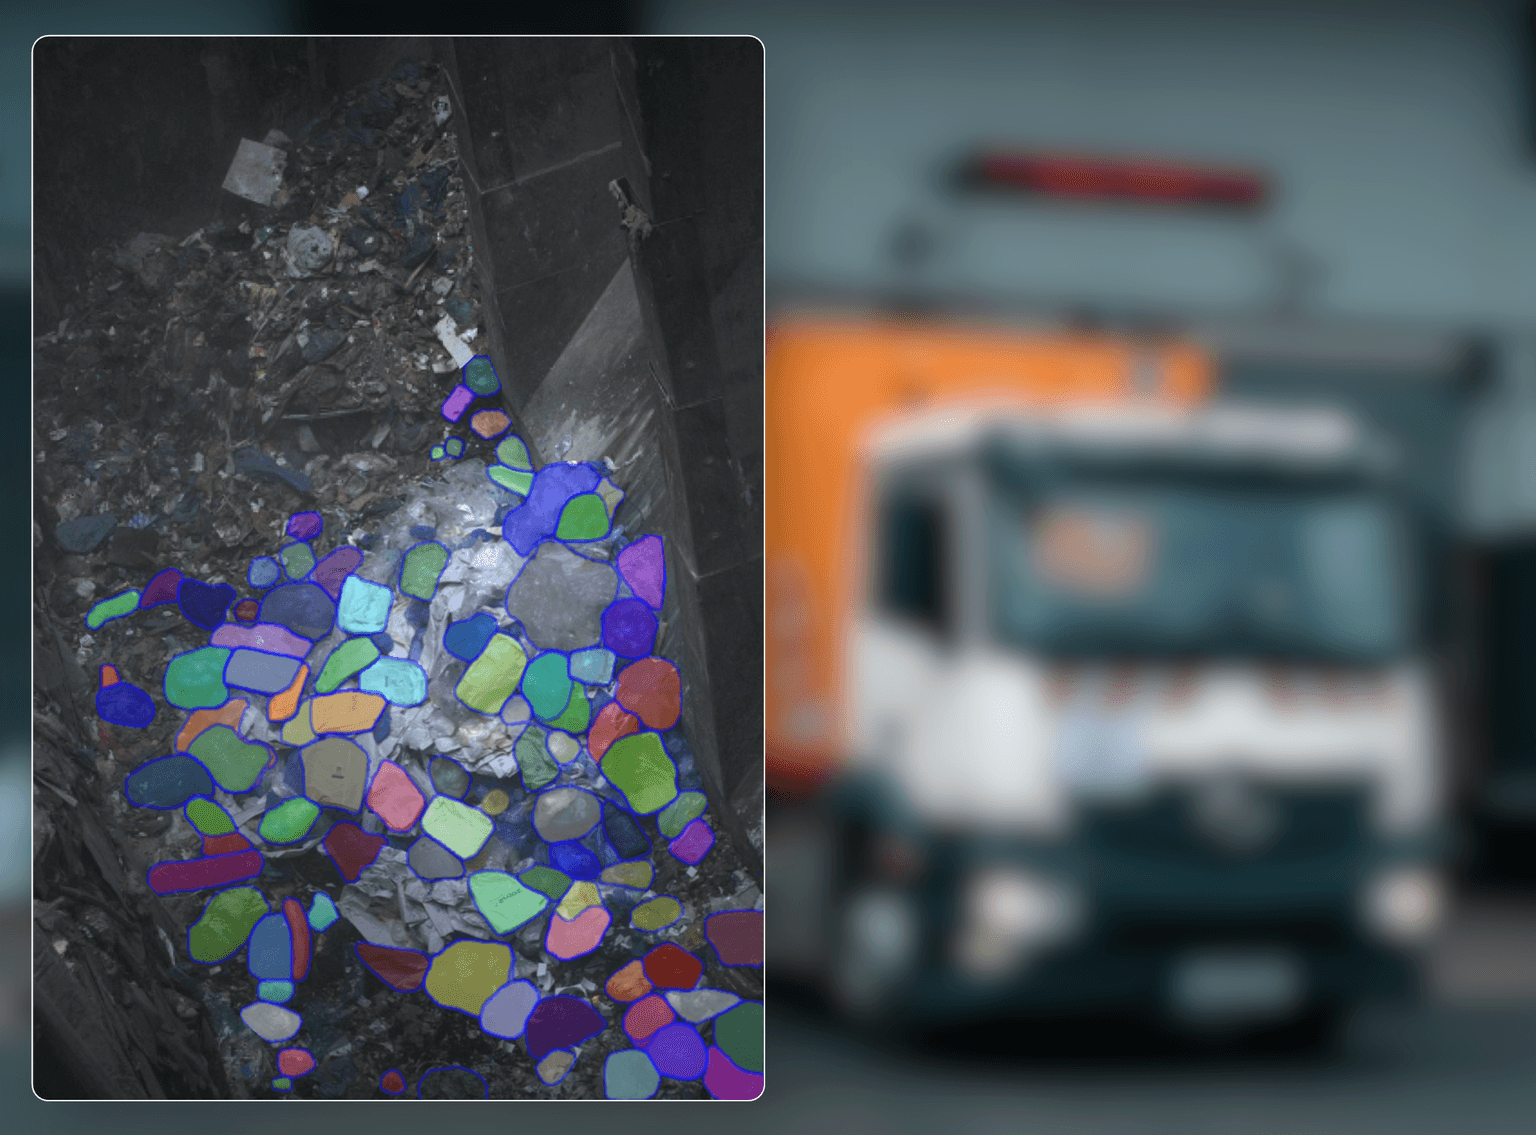
Waste composition analysis is the process of determining what is actually inside a load of waste before it reaches the grate or the shredder: how much of it is combustible, how much is moisture and inert material, what calorific value the mix is likely to produce, and whether it is carrying anything that should not be there at all. For most European energy-from-waste (EfW) plants, that determination still runs on periodic lab sampling: a few kilograms pulled from a truck, sorted by hand, extrapolated to represent tons of mixed municipal and commercial waste, once or twice a shift. That workflow was built for an era when feedstock was more consistent and unplanned downtime was priced in as a cost of doing business. Neither assumption holds well today.
Unplanned downtime at waste-to-energy and biomass plants averaged 22.9 days a year in 2021, with 43% of that downtime tied to boiler-related issues and 9.9 days a year attributable to boiler failures specifically, according to POWER Magazine's analysis of the sector. A grab sample taken once per shift does not catch the composition swing that happens between samples, and it does not catch a contaminant buried inside a load at all. This guide covers how AI-based waste composition analysis actually works, what changes operationally on the calorific value side and the contaminant side, where the data feeds into bunker management and compliance reporting, and what to check before buying a system.
How AI-based waste composition analysis works
The mechanism is straightforward to describe even though the underlying models are not: cameras watch the waste as it is delivered, a model interprets what the cameras see, and the output reaches operations staff fast enough to act on the load in question, not the next one.
Camera capture at the tipping point
Composition analysis starts at the point where waste actually enters the process: the tipping point, where trucks discharge into the bunker (fosse, foso, fossa depending on the plant's home country, all the same physical pit) or onto the tipping floor. Fixed cameras mounted at the bunker edge capture the unload as it happens, continuously, rather than at a scheduled interval. Waste does not unload evenly. Dense material tends to clear the truck bed first, lighter and bulkier material spreads out toward the end of the discharge, and a single still photograph would only catch a slice of that variation. Continuous capture across the full unload sequence is what makes it possible to reason about a whole delivery instead of a hand-picked frame that happened to be convenient.
Camera placement and housing matter more than the choice of model architecture in practice. Bunker environments are dusty, hot, and vibration-heavy, and a camera that cannot stay clean and correctly aligned over months of continuous operation produces unreliable input regardless of what runs on the other end. Vendors that have actually operated in live bunkers, rather than tested against curated datasets, tend to talk about cleaning cycles, vibration mitigation, and housing design before they talk about model accuracy, and that ordering is a reasonable signal of how seriously a system was built for the environment it runs in.
From image to composition estimate
Those images feed a vision model trained to recognize the visual signatures that correlate with waste composition: the mix of packaging, organics, textiles, and fines visible on the surface, moisture cues such as sheen and clumping, and the density and volume the load occupies in the frame. The model does not physically sort the waste the way a lab technician would. It infers composition and calorific value from what is visible, in the same way an experienced crane operator learns to read a load by eye and adjust the mix accordingly, except doing it consistently, on every delivery, with a timestamped record attached to each estimate rather than a judgment call that leaves no trace.
This is why the output should always come with an explicit sense of its own uncertainty rather than a single confident number. A delivery with a clean, well-lit, largely uncovered load produces a tighter estimate than one that arrives compacted, bagged, or partially obscured by tarps and larger items. A system that reports the same apparent confidence regardless of what it can actually see is a system that has not been calibrated against the reality of a working bunker, as opposed to a lab bench with ideal lighting and a small, curated set of test loads.
What gets detected: contaminant classes and calorific value together
The same camera pass that produces a calorific value estimate also screens for contaminants: items that should not be in the load at all. Gas cylinders and aerosol canisters are the class operators care about most because of the safety implications, but the same detection layer typically also covers batteries, bulky metal, and other objects that can damage equipment or interrupt the feed sequence. Running both functions off the same image capture is a deliberate design choice, not an incidental one. A load with an unusually high share of dense, low-calorific packaging waste and a load carrying a concealed gas cylinder are both a form of variance the operator needs visibility into, and both are visible in the same frame at the same moment, so there is no reason to run two separate systems to catch them.
Calorific value analysis: what it changes operationally
Calorific value analysis is the part of waste composition analysis that most directly touches combustion. Getting it from a periodic lab exercise to a continuous, per-delivery measurement changes what operators can actually do with the number.
From periodic lab samples to continuous per-delivery estimates
A lab-based calorific value determination is defensible as a monthly or quarterly average, the kind of figure that goes into a report and stands up to scrutiny months later. What it cannot do is tell an operator anything about the specific delivery that caused an unusual combustion event three shifts earlier. Continuous, per-delivery estimation closes that gap. Instead of one data point standing in for a shift's worth of trucks, every delivery gets its own estimate, tied to a timestamp, a vehicle, and where the plant tracks it, a supplier.
That granularity is what lets an operator go back after the fact and ask which specific load correlates with a specific furnace event, rather than concluding only that the day's average feedstock ran hotter or cooler than usual. It also changes the conversation with suppliers. A single monthly average gives an operator very little to point to in a quality discussion. A record showing that deliveries from a specific source consistently arrive with an unusually variable calorific value, or with a disproportionate share of the load's contaminant flags, is a different kind of evidence, and a much more specific one.
Boiler stability and combustion control implications
None of this replaces the furnace control system, and it should not be sold as if it does. What it changes is the information available before the load reaches the grate. A crane operator working from a calorific value estimate for each delivery has a basis for blending high- and low-value material across bunker sections rather than loading whichever section happens to be nearest to the grab. That blending decision is the practical mechanism by which composition visibility feeds into steadier combustion. It is not a guaranteed reduction in any specific failure mode, and no operator should expect it to be marketed that way. What it plausibly reduces is the frequency with which the furnace is fed feedstock well outside the band the boiler was tuned for, and the frequency with which an undetected contaminant reaches the grate or the shredder at all.
Given that boiler-related issues accounted for 43% of unplanned downtime industry-wide in 2021, per the POWER Magazine analysis cited above, closing the visibility gap between what arrives at the gate and what the crane operator can see addresses one of the larger operational levers available to a plant that does not control what shows up in its trucks. It is a mechanism, not a guarantee, and it is worth treating it that way in any internal business case.
Contaminant detection: what it changes operationally
Contaminant detection covers two categories that are worth keeping distinct, because the operational response to each is different: items that are an acute safety hazard, and items that are a mechanical or maintenance risk without being an immediate danger.
Safety-critical items such as gas cylinders and nitrous oxide canisters
Gas cylinders, and nitrous oxide canisters specifically, are the most safety-critical class of item that turns up in mixed municipal and commercial waste. A pressurized cylinder that reaches a furnace running at combustion temperature, or that is crushed by a crane grab or a shredder blade before it ever gets that far, is a genuine hazard to equipment and personnel, not a theoretical one. Detection at the tipping point, before the load is spread or moved further into the bunker, gives operations staff the option to isolate that specific pile, flag it for the crane operator, and keep it out of the feed sequence until it has been physically dealt with, rather than discovering the problem once it is already inside the process.
Wasteer covers gas cylinder and nitrous oxide detection specifically in more depth elsewhere, including how a detection event is logged, timestamped, and surfaced to the crane operator in a form that supports an immediate operational decision rather than a note for the following week's review meeting.
Bulky items, shredder and grate protection
Beyond the acute hazard class, contaminant detection also covers items that are a mechanical rather than a safety risk: bulky metal, dense inert material, and other objects that were never going to combust cleanly and are more likely to damage a shredder blade or sit unburned on the grate, affecting burnout quality. These items rarely make headlines the way a cylinder incident does, but they are a steady, quiet source of unplanned maintenance. A load-level record of where and how often they show up gives maintenance teams an actual pattern to plan around, rather than a series of disconnected incident reports that never quite add up to a cause.
Bunker management: where composition data becomes a feed decision
Detection and estimation are only useful if the data reaches someone who can act on it before the load is committed to the furnace. That is the role of bunker management: taking the calorific value estimate and the contaminant flags generated at the tipping point and turning them into a concrete instruction, mix this section with that one, hold this specific pile, sequence this delivery ahead of that one, at the point where the crane operator is actually working the pile.
This is where the distinction between "the data exists" and "the data changes anything" actually matters. Composition data that sits in a report nobody opens until the following week does not change what gets fed to the grate today. Composition data attached to a specific, still-identifiable pile in the bunker, visible to the crane operator at the moment of the grab, does. Wasteer's own coverage of how contaminant detection and calorific value feed into bunker management goes into that workflow in more detail, including how flagged loads are kept visually and physically distinct from the rest of the bunker floor until they are resolved.
There is also a resource-recovery angle worth noting on what gets flagged rather than simply discarded. As material recovery becomes a larger part of the economic case for sorting effort at EfW sites, it is worth understanding how flagged contaminants become a resource-recovery input rather than pure waste, once they are identified and pulled aside instead of going straight into the furnace feed.
Compliance and documentation: where this data feeds reporting
None of this is a substitute for the statutory measurement and reporting obligations EfW operators already carry. In Germany, the 17. BImSchV (as amended February 2024) sets the air emission limits that govern the incineration and co-incineration of waste, and delivery documentation continues to run through the Nachweisverordnung (the German waste documentation regime, tracked electronically via eANV) regardless of what a vision system observes at the bunker edge. A composition analysis system sits alongside those obligations, not in place of them.
What continuous composition data adds is a supporting record of a different kind than a periodic lab result: a timestamped, load-level account of what actually arrived at the plant. That is useful in a different way than a monthly average. When a plant needs to trace an unusual emissions reading or a combustion upset back to a specific delivery, or needs to have an evidence-based conversation with a supplier about repeated contamination or composition variability, a continuous record is what makes that possible. A quarterly average was never built to answer a question at that level of granularity, and it is not a fair criticism of lab sampling that it cannot; it simply was not designed for that purpose.
The same underlying composition data has a further use as measurement and reporting expectations for the sector continue to evolve. Wasteer has written separately about how the same composition data supports MRV reporting, the monitoring, reporting, and verification discipline that is becoming more central to how EfW plants document their fossil and biogenic waste shares over time.
What to check before buying an AI waste analysis system
A few questions separate a system that will actually hold up in a working bunker from one that looked good in a demo:
- Deployment footprint. What hardware does it actually need on-site: cameras, an edge server, network connectivity? Does it require integration with the crane control system, the DCS/SCADA layer, or the scale system, or can it run as a standalone layer that operations staff read from a screen without touching existing control infrastructure?
- Calibration to bunker reality, not lab conditions. Ask specifically how the vendor validated the system against dusty, hot, poorly lit, partially occluded loads, as opposed to a curated test set. A vendor that can only speak to accuracy under ideal conditions has not yet proven the harder case, which is the case that actually shows up on a Tuesday afternoon in a working bunker.
- How uncertainty is communicated. A system inferring composition from images should express a confidence range that widens when visibility is poor and tightens when it is good, not report the same fixed number regardless of what the camera can actually see.
- Track record across live plants, not pilots. Ask how many facilities are running the system in production, for how long, and in what conditions. Wasteer, for instance, was already in use in more than 20 plants as of its own May 2025 update on deployment progress, a scale that reflects operating conditions across multiple countries and plant types rather than a single showcase installation.
- What happens when a contaminant is flagged. Is the alert delivered in a form the crane operator can act on immediately, with a clear image and location, or does it land in a dashboard that someone has to remember to check?
- Data ownership and retention. Who owns the images and the derived data, how long is it retained, and can it be exported for the plant's own compliance or supplier discussions rather than staying locked inside a vendor's interface?
- What the system does not do. Any vendor that presents composition analysis as a replacement for statutory measurement, rather than a complement to it, should be treated with caution. The honest answer to "does this replace our lab sampling obligations" is almost always no, and a vendor that says otherwise is either wrong about the regulatory picture or overselling the product.
FAQ
Does AI waste composition analysis replace lab sampling and statutory measurement obligations? No. It runs alongside statutory measurement and reporting requirements such as those under the 17. BImSchV and the Nachweisverordnung, not in place of them. What it adds is continuous, load-level visibility between the periodic measurements a plant is already required to take, which is useful for operational decisions and supplier conversations even though it does not substitute for the formal record.
How does the system handle loads that are compacted, bagged, or partially covered by tarps and larger items? Visibility varies with how the load presents itself, and a well-built system should say so rather than hide it. A clean, largely uncovered load produces a tighter estimate; a compacted or heavily bagged load produces a wider confidence range because less of the composition is actually visible to the camera. Operators should expect and ask for that range rather than a single number presented with false precision.
What happens operationally when a gas cylinder or nitrous oxide canister is detected? The system flags the item with an image and a location at the point of capture, and that alert reaches operations staff fast enough to act on the same load rather than one further along in the process. The typical response is to isolate the flagged pile, keep it out of the immediate feed sequence, and handle it according to the plant's own hazardous-item procedure, with the detection event logged for later reference.
Does deployment require changes to our crane control system or DCS/SCADA setup? Not necessarily. A standard deployment centers on cameras at the tipping point, an on-site edge server, and a cloud or on-premise application that surfaces results to operations staff. Integration with existing scale, ERP, or DCS/SCADA systems is typically available where a plant wants it, but a plant can run the system as a standalone information layer without touching its existing control infrastructure.
Is this only relevant for very large plants, or does it hold up for smaller EfW facilities too? The mechanism, camera capture at the tipping point feeding a vision model, does not depend on plant size. What varies by plant size is the calculus around cost and integration complexity, which is exactly why it is worth asking a prospective vendor for reference deployments at a facility of comparable scale before committing, rather than relying on figures from a much larger reference site.